
Benchmarking 2025 reveals spectacular differences between industrial sectors. Is your OEE of 68% excellent or worrying? This exclusive study analyzes data from 3,500 plants in 12 countries to help you position yourself against the global competition.
| Sector | OEE Low | OEE Medium | OEE Good | World-Class |
|---|---|---|---|---|
| Automotive | <65% | 65-75% | 75-85% | >85% |
| Food industry | <55% | 55-65% | 65-75% | >75% |
| Pharmaceuticals | <60% | 60-70% | 70-80% | >80% |
| Metallurgy | <50% | 50-60% | 60-70% | >70% |
| Plastics | <60% | 60-70% | 70-80% | >80% |
| Electronics | <70% | 70-80% | 80-88% | >88% |
The “World-Class” threshold represents the top 10% of production sites. This digital piloting experience requires excellence in availability, performance and quality.
Data analysis : Why the Sector Discrepancies?
Electronics dominates, with an OEE >of 88%, thanks to advanced automation, short cycle times and maximum standardization. Massive R&D investment (8-12% of sales) and mature predictive maintenance make the difference.
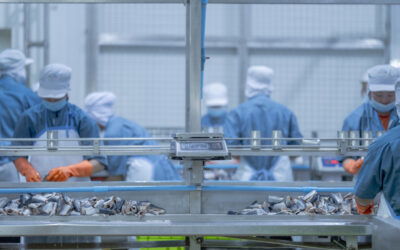
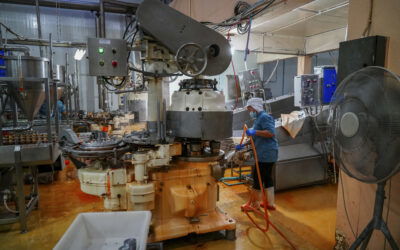
The food industry has the lowest OEE (>75%), due to structural constraints. Mandatory sanitary cleaning consumes 15-20% of available time. Variability of raw materials, frequent format changes and strict regulations limit performance.
The metalworking industry faces specific challenges: aging equipment (20-40 years), very long changeover times (up to 8 hours) and thermal constraints. Supervisory benchmarking reveals a potential improvement of +12 points with digitalization.
International Comparative Study Report
| Country | OEE Average | Evolution 2020-2025 | Key factors |
|---|---|---|---|
| Japan | 74% | +6 points | Kaizen culture, IoT/IA +180% |
| Germany | 71% | +5 points | Industry 4.0, R&D 3.1% GDP |
| France | 66% | +4 points | Digitalization +62% |
Japan leads the way thanks to 70 years of continuous improvement, with 120h of training/year/employee (vs. 32h in France). Toyota boasts a 91% OEE rate, with 8,000 suggestions per employee/year. Germany excels with its mature Industry 4.0: 78% of factories digitized (vs. 52% in France). France is accelerating, with +62% of plants equipped with MES/OEE by 2020.
Trends 2020-2025: The 3 Technology Waves
The global OEE has risen from 58% (2020) to 68% (2025), i.e. +10 points.
Wave 1 (2020-2021): Digitalization forced by COVID-19, IoT sensors -73% in cost, digitalized factories +3.2 points vs +0.8 others.
Wave 2 (2021-2023): predictive AI reduces downtime by 25%. Michelin: OEE 76%→84% in 18 months, ROI 340%.
Wave 3 (2023-2025): Digital twins optimize virtually. Airbus: -40% changeover time.
Average ROI on digital transformation: 300% over 3 years.
Your Improvement Strategy
Define your target OEE
Don’t copy blindly. Compare yourself to plants in a similar context. A call to benchmark all your direct competitors’ benchmarks is essential when it comes to performance.
4-step method: (1) Measure over 3 months, line by line, shift by shift. (2) Identify your position: Red = emergency, Orange = SMED/TPM, Green = AI/predictive. (3) Analyze: OEE = Availability × Performance × Quality. (4) Set +5 points/year.
Phase Progression Plan
Stabilization phase (60→65%, 6-9 months) – IoT sensors, Top 10 failure analysis, level 1 maintenance training. Investment 50k€, ROI 80-150k€.
Improvement phase (65→75%, 12-18 months) – SMED (-30-50% changeover time), TPM level 1, microstop reduction. Investment 120k€, ROI 300-500k€.
Optimization phase (75→85%, 18-24 months) – Predictive maintenance, product mix optimization, full digitalization. Investment 200k€, ROI 900k€.
Assess Your Potential
Delayed profile (OEE <60%) = potential +20-30 points over 3-4 years, priority measurement and quick wins.
Continuous Improvement Profile (OEE 65-75%) = potential +10-15 points over 2-3 years, focus on SMED/TPM and digitalization.
Champion profile (OEE >75%) = potential +5-8 points towards World-Class, priority predictive AI and digital twins.
The 5 priority levers
All benchmarks identify: (1) Availability – reduce breakdowns -30% with predictive, (2) Changeovers – SMED under 10 minutes, (3) Microarrests – 25% of lost time, (4) Quality – AI anomaly detection, (5) Training – 80% of success comes from the teams.
Comparative data: Training France 32h/year vs Japan 120h/year. Digitization France 52% vs Germany 78%. R&D investment France 1.8% vs Germany 3.2%.
The 2025 study report confirms that each sector has its own constraints. An OEE of 68% in the agri-food sector may be excellent (top 25%), but the same in electronics indicates a lag.
Take action with TEEPTRAK: measure in real time, compare yourself with industry benchmarks and identify your priority levers.
Request your free demo and discover your hidden +10 OEE points!

0 Comments