What indicators should you use to measure the performance of your machines?
To achieve the objectives of a Lean approach focused on machine performance, it is necessary to exploit all the data linked to machine performance and availability.
In this article, we will look at a selection of indicators that can be used to analyse the productivity of your machines.
Maintenance monitoring indicators
Machines need to be closely monitored so that maintenance departments know when to intervene and what the consequences of a repair would be in terms of lost time and therefore productivity.
The performance of maintenance operations plays a major role in a company’s overall productivity, and this section looks at a selection of indicators that can be used to measure this performance.
- MTBF – Mean Time Between Failure = Temps Moyen Entre Pannes
Expressed in hours, the Mean Time Between Failure (MTBF) is an indicator that can be used to determine whether a piece of equipment is reliable.
It can be a decisive factor in the decision to replace equipment if it is deemed too short, leading to repeated stoppages and consequent losses in performance and productivity.
MTBF = Gross Run Time / Number of Faults
- MTTR: Mean Time To Repair
MTTR shows how much time is needed, on average, to detect and locate a fault and replace the defective part, and can highlight the need to find solutions to make maintenance operations simpler and faster.
MTTR = Failure Time / Number of Failures
Machine performance indicators
Here is a selection of indicators you can use to analyse the productivity of your machines.
- Synthetic Efficiency Ratio – SER
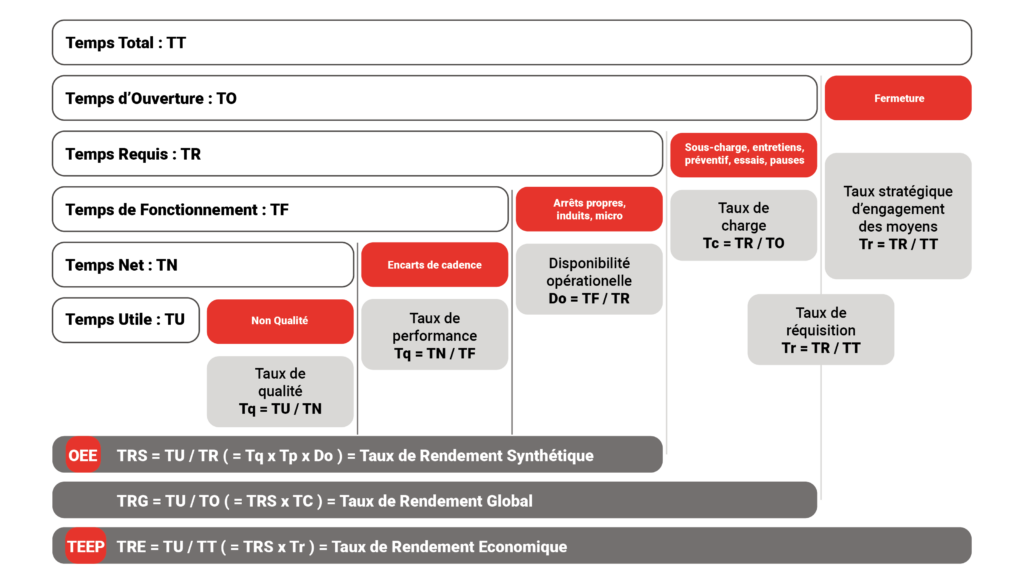
It expresses the company’s ability to use the equipment made available to it to the best of its ability, based on the time during which the equipment is given to production for use.
It can find out how the equipment has performed according to 3 criteria:
- Availability
- Their performance
- Quality
Calculating the OEE
The TRS breaks down into 3 rates:
Availability rate – Do : This represents the percentage of opening time during which equipment is ready to work. Performance rate – Tp : This represents the percentage of gross operating time during which production is carried out at the planned rate.
Quality rate – Tq : This represents the percentage of net operating time spent making good parts.
TRS = Tq * Tp * Do

TRS gives you an accurate picture of the efficiency of your manufacturing process and makes it easy to track improvements over time.
- General Rate of Return – GRR and Economic Rate of Return – ERR
The General Rate of Return (GRR) and the Economic Rate of Return (ERR) are less often used, but are just as interesting for a relevant analysis of productivity.
The ERR provides visibility of your machine’s profitability in relation to its uptime over a specific period. This is the time actually spent producing quality over 24 hours.
This rate also provides important information on the overall capacity of a machine to deliver quality production, enabling the company to refine its investment strategy.
TRE = TU / TT
The Overall Equipment Efficiency Ratio (OER) measures the level of efficiency of a piece of equipment in relation to the actual opening time of the workshop, i.e. the time used to produce quality over the workshop opening period.
This rate can be revealing when it is discovered that it is necessary to add an extra team to achieve the expected production targets.
TRG = TU/TO
- True Downtime Cost (TDC) and percentage of downtime
How much money does your company lose every minute or hour your machines are down? This is the question frequently asked when analyzing the production losses of a machine, but which unfortunately only arises when the machine breaks down.
It’s important to remember that even a small percentage reduction in downtime can save your business millions of euros. So by calculating your cost of downtime and identifying associated improvements, you can demonstrate time and cost savings, as well as reductions in waste.
- Using capacity
The effective cost of owning and maintaining equipment is reduced when that equipment is used at full capacity. By measuring the output that is actually produced by your equipment and comparing it to what could be produced, you understand the efficiency of your operation.
When your plant increases its capacity utilisation rate, it increases its efficiency.
TeepTrak allows you to detect the on or off state of each piece of equipment. This detection will ensure the automated calculation of most of the indicators mentioned above. What’s more, this will provide you with significant support in terms of direct feedback on the influence of your improvement actions on your machines, and therefore better visibility of the monitoring of your Lean approach.


0 Comments