Controlling or piloting, a nuance that makes all the difference.
Whether it’s quality, performance or safety, we instinctively think of control as a way of feeding indicators. But what is control? Control is the action of checking something or someone, verifying their state or situation in relation to a standard. In other words, we check whether we have achieved our objective. An example is quality control:
At the end of the production line, the part is inserted into a gauge to ensure that the dimensions are correct. If the product does not meet expectations, it is simply scrapped for recycling.
In this case, quality control fulfils its role, with the vast majority of compliant parts delivered to the customer. We’re talking about the vast majority, because human error is still possible – it’s conceivable that a non-compliant part could slip through the net.
When it comes to performance, the same thing happens in companies today. Production managers set production targets on a team or daily basis, then the next day we observe the results. We check: What are the results? Has the objective been achieved? What are the reasons for the variance? Here are the questions producers will have to answer.
Control means looking after the action. When a non-conformity is observed during quality control, it’s already too late. The part has been produced and thrown away. When the previous day’s non-performance is highlighted by the indicators, it’s already too late. But what’s the difference with steering?
What is the difference between control and management?
Steering is getting closer to control. We will always talk about indicators. However, it brings out two very important concepts. Time intervals and levers.
Levers are the means of acting on indicators. If the indicator is the speedometer, the lever is the accelerator pedal. When my speed is too low or too high, I act on my lever to be precisely at the desired speed. In industrial driving, it’s the same principle. You have to use levers on the shop floor to achieve your objective. So you need to choose indicators on which your producers can have an impact.
To illustrate this, here’s an example: the customer satisfaction rate is frequently mentioned in workshops. Try to imagine how your employees see this indicator… They see it as a consequence, but above all as an indicator on which they have only a minor impact, if any at all. Now, replace this indicator with a workshop and target it more. If you were to choose ‘Percentage of product delivered on time’, everyone involved in production would have an impact on this objective. This way, everyone on the shop floor feels involved.
Now that we know how to involve every employee in the company, let’s talk about the time interval. Let’s go back to our car and manage our accelerator pedal. When we’re driving, we monitor our speed regularly. For driving, it’s the same thing again. We check our indicators at much shorter intervals and adjust the levers more frequently to be on target in real time. If we spend the day or the team on target in real time, we are sure to achieve the day’s objective at the end of the day.
How do you drive?
How can we steer our workshop towards a steering dynamic? Now that the differences between management and control are clearer, we can move in the right direction. First, let’s talk about quality. The ultimate aim of quality management is to reduce as far as possible all control operations that do not add value for the customer. ALL quality checks are a waste of time and money. Of course, this avoids sending non-conformities to the customer, but today there are ways of managing quality very finely with the aim of producing ‘right first time’.
Statistical process control is one such method. By monitoring variables in real time, it makes it possible to ensure quality levels. But what variables can tell us our level of quality? If you study the rejects caused by your machine, you will see that the causes follow Pareto’s law. 80% of rejects come from 20% of the causes.

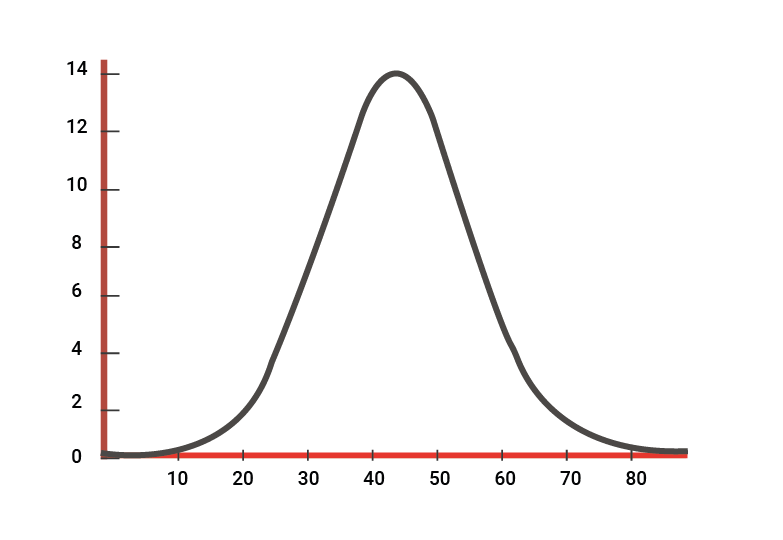
The 20% of cases are ‘easy’ to follow. Generally speaking, these are sensitive ratings, which are more difficult to maintain. Analysis of these variables shows that if the setting is constant, the distribution follows a reduced centred normal distribution. In other words, the variable’s distribution curve follows a bell shape, with two important characteristics: The mean and the dispersion. Once you have mastered these two characteristics for your scrap causes, you will enter the world of quality management.
This is the simplified principle of statistical quality control. It may seem a long way from the workshop in its approach, but the relationship between normal law and machine setting is no longer in doubt.
In the same vein, there are performance management techniques for breaking the habit of control. Lean Management has popularised one of these techniques, known as short interval animation (SIA).
To apply AIC, it is necessary to use indicators over which the producers have control. Once these indicators are in place, you can expect the workshop to be more proactive in solving problems. With this type of facilitation, solutions will emerge as close as possible to their source. What’s more, by applying this method you give operators the opportunity to act on your indicators, and therefore the chance to achieve their objectives. A large part of this method is based on the notion of intervals: the closer they are, the more accurate your management will be.
Are you ready to take the plunge?
Here are a few keys to help you understand the concepts of control and steering and to help you take the right direction. Implementing these management systems takes time and resources, but their effectiveness has been proven. They will enable you to get the most out of your machines and improve productivity.


0 Comments