
The indicator alone improves nothing
Here’s an inconvenient truth aboutOEE operators: overall equipment efficiency alone doesn’t improve anything. A performance indicator displayed in an office has never made a machine run faster, reduced a changeover time or prevented a micro-stop on a production line.
What improves OEE is the operators. But only when they have real-time yield rates, visible causes of stoppages, and a simple system for taking action. So the real question is not “how to calculate OEE”, but how to transform field teams into production performance players?
The 5 obstacles to commitment in the field
In most industrial companies, there are five major obstacles preventing operators from getting involved in improving OEE, and holding back equipment productivity.
First obstacle: no access to data. The operator discovers his OEE the next morning, in an Excel report he doesn’t even read. Impossible to act on a problem that occurred yesterday at 2:32pm. This lack of real-time visibility generates considerable productivity losses.
Second obstacle: manual data entry. Filling out paper sheets in the middle of production is time-consuming, error-prone and, frankly, demotivating. Actual production time is lost to administrative tasks.
Third obstacle: misunderstood indicators. Many operators don’t understand what OEE is, or how their actions impact on it. Without appropriate employee training, the quality rate and other components remain abstract. The result: total indifference.
Fourth obstacle: contradictory visions. The operator sees a breakdown. The team leader talks about a series change. Maintenance refers to an adjustment. Without standardization of downtime causes by category, it’s impossible to create a common language for analyzing causes.
Fifth obstacle: overly complex tools. Manufacturing execution systems impose cumbersome interfaces, multiple screens and complicated data entry. The operator loses more time informing the system than producing, which impacts on useful operating time.
What really engages teams
Contrary to what many managers think, it’ s not the KPI that motivates an operator. Displaying “OEE: 68%” on a screen doesn’t change anything in his day-to-day life, even if this percentage of time is important to management.
What engages him is understanding the impact of what he does. Seeing first-hand that an adjustment reduces microarrests by 15%. Seeing that his idea has saved 2 points in OEE. It’s this transparency that creates value and encourages decision-making in the field.
He is committed tobeing valued and recognized as the person best placed to identify problems at his workstation. What engages him is to
5-step method for involving operators
The involvement of operators follows a precise method that takes into account production processes and company objectives.
1. Make OEE visible in real time. Install workshop screens displaying current OEE, stoppages and losses. Information must be accessible at a glance. This visibility optimizes equipment use.
2. Standardize causes of downtime. Create a common list: “Paper jam”, “Material wait”, “Quality adjustment” rather than cryptic codes. Establish a clear order of priority for each category of stop.
3. Give a simple interface. Touch pad, visual buttons, two-click validation. Input must take less than 10 seconds, otherwise the operator won’t do it.
4. Train and explain. Take 30 minutes to explain what OEE is, with a practical example of how to calculate it, and why the three components are important. Operators catch on quickly.
5. Create short routines. Five minutes at the start of the shift to look at the previous day’s OEE, identify the three main stops, decide on an action.
Availability: understanding and reducing losses
Availability represents the ratio to theoretical production time. It is the first OEE factor, and the one where operators have the most immediate impact. Losses in availability include breakdowns, changeovers and adjustments.
On a production line, every minute counts. A trained operator who identifies a drift can call maintenance before the problem becomes a complete stoppage. This reactivity transforms a 30-minute loss into a 5-minute intervention, with a direct impact on production rate and equipment lifespan.
Production performance: optimize cycle time
Performance rate measures actual speed in relation to theoretical cycle time. Speed losses are often invisible without real-time measurement: micro-stops, slowdowns, reduced cycle rates.
This is where the operators’ commitment makes all the difference. They are the only ones who can identify when a setting reduces output by 5%, when a change of raw material causes slowdowns, or when a particular manufacturing operation generates repeated micro-stops. This on-the-ground knowledge is a gold mine for cost reduction and improvement.
Product quality: reducing defects at source
The quality rate represents the ratio to the total number of parts produced: number of conforming products divided by total number of products. Reducing defects starts at the workstation, not at quality control.
When an operator sees in real time that his scrap rate is increasing, he can correct it immediately: adjust a parameter, check a setting, change a tool. This reactivity guarantees the company’s quality standards and avoids massive losses in the production cycle.
Real-time system transforms operations
Let’s take a concrete example to illustrate the difference in manufacturing operations.
No real time: a micro-stop occurs at 10:45. The operator corrects it. The next day, the team leader discovers that there have been 12 similar micro-stops, totalling 45 minutes of loss. He mentions this at the weekly meeting. A week later, maintenance is called in. Two weeks have passed, and hundreds of stoppages have occurred. Data processing is too late.
With real time: the second micro-stop occurs at 11:10. The operator sees on the screen that it’s the same problem. He immediately calls maintenance. Intervention within the hour. The other ten micro-stops never occur. Immediate gain: 35 minutes production time, significant cost reduction.
The operator becomes a key player in performance, because he has the information at the moment when he can act. The system gives them the visibility they need to make the right decisions, creating a continuous improvement cycle. This success factor is based on a level of transparency unprecedented in industrial fields.
What TeepTrak can do for you
This operator-centered approach is exactly what TeepTrak has developed in over 400 plants across several industrial regions.
Total elimination of paper-based data entry: data is automatically entered, and the operator simply qualifies the stops via an ultra-simple touch interface. A line where operators used to spend 20 minutes per shift is now down to 2 minutes. This directly improves return on investment.
Real-time OEE display on workshop screens visible from everywhere. Each operator sees his indicator evolve in real time, understands the impact of his actions, and identifies any deviations. This visibility creates a culture of transparency.
Instant classification with standardized causes. No more cryptic codes, no more different interpretations. The system takes into account all stop categories in a consistent way.
The natural implication that follows from this visibility. When an operator sees his OEE drop from 72% to 68%, he looks for the cause. He proposes solutions. He tests adjustments in the field.
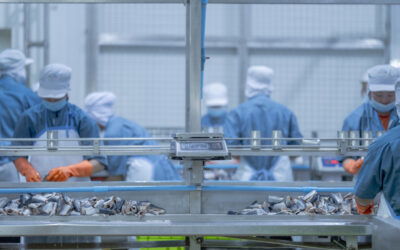
Practical example: food processing line +6 points in 4 weeks
This article is based on concrete results from case studies. A food packaging line had been running at 64% OEE for months. The operators had never seen this indicator before.
TEEPTRAK system installation with real-time screens. 30-minute training session.
First discovery: operators identify that 40% of their losses come from micro-stops during format changeovers.
Second discovery: a simple adjustment of coil positioning reduces these microstops by half.
Result in four weeks: the OEE increased from 64% to 70%, simply thanks to the involvement of the teams. This success demonstrates the value of overall equipment effectiveness when put in the hands of the right people. No machine investment. No recruitment. Just visibility and empowered operators.
Conclusion: putting people at the heart of performance
Installing an OEE measurement system is easy. Involving operators in continuous improvement is quite another.
The difference is not in the quality of the sensors. It’s the ability to transform information into action, data into decisions in the field, indicators into commitment.
It’s the team members who transform performance when they’re given visibility. The real factor is people equipped with the right tools at the right time.

0 Comments